Caywork Platform
Author at Caywork
Every AI agent deployment eventually gets asked the same question by finance: when does this pay for itself? The honest answer is that it depends on the workflow, but a clear pattern has emerged across enterprise deployments in 2025 and 2026. ROI does not arrive all at once. It builds in stages across the first 90 days, and knowing what to expect at each stage makes the difference between a program that scales and one that gets quietly shut down before it proves its value.
Why AI Agent ROI Takes Time to Materialize
Leaders who expect an AI agent to pay for itself in the first week are usually disappointed, not because the technology fails, but because value compounds through onboarding, tuning, and adoption rather than appearing on day one. Enterprise research from 2026 consistently shows a gap between deployment and measurable return, and understanding why that gap exists is the first step to managing it. The sections below break down what actually happens during that ramp-up period and why some programs take longer than others to show results.
Setting Realistic Expectations Before Deployment
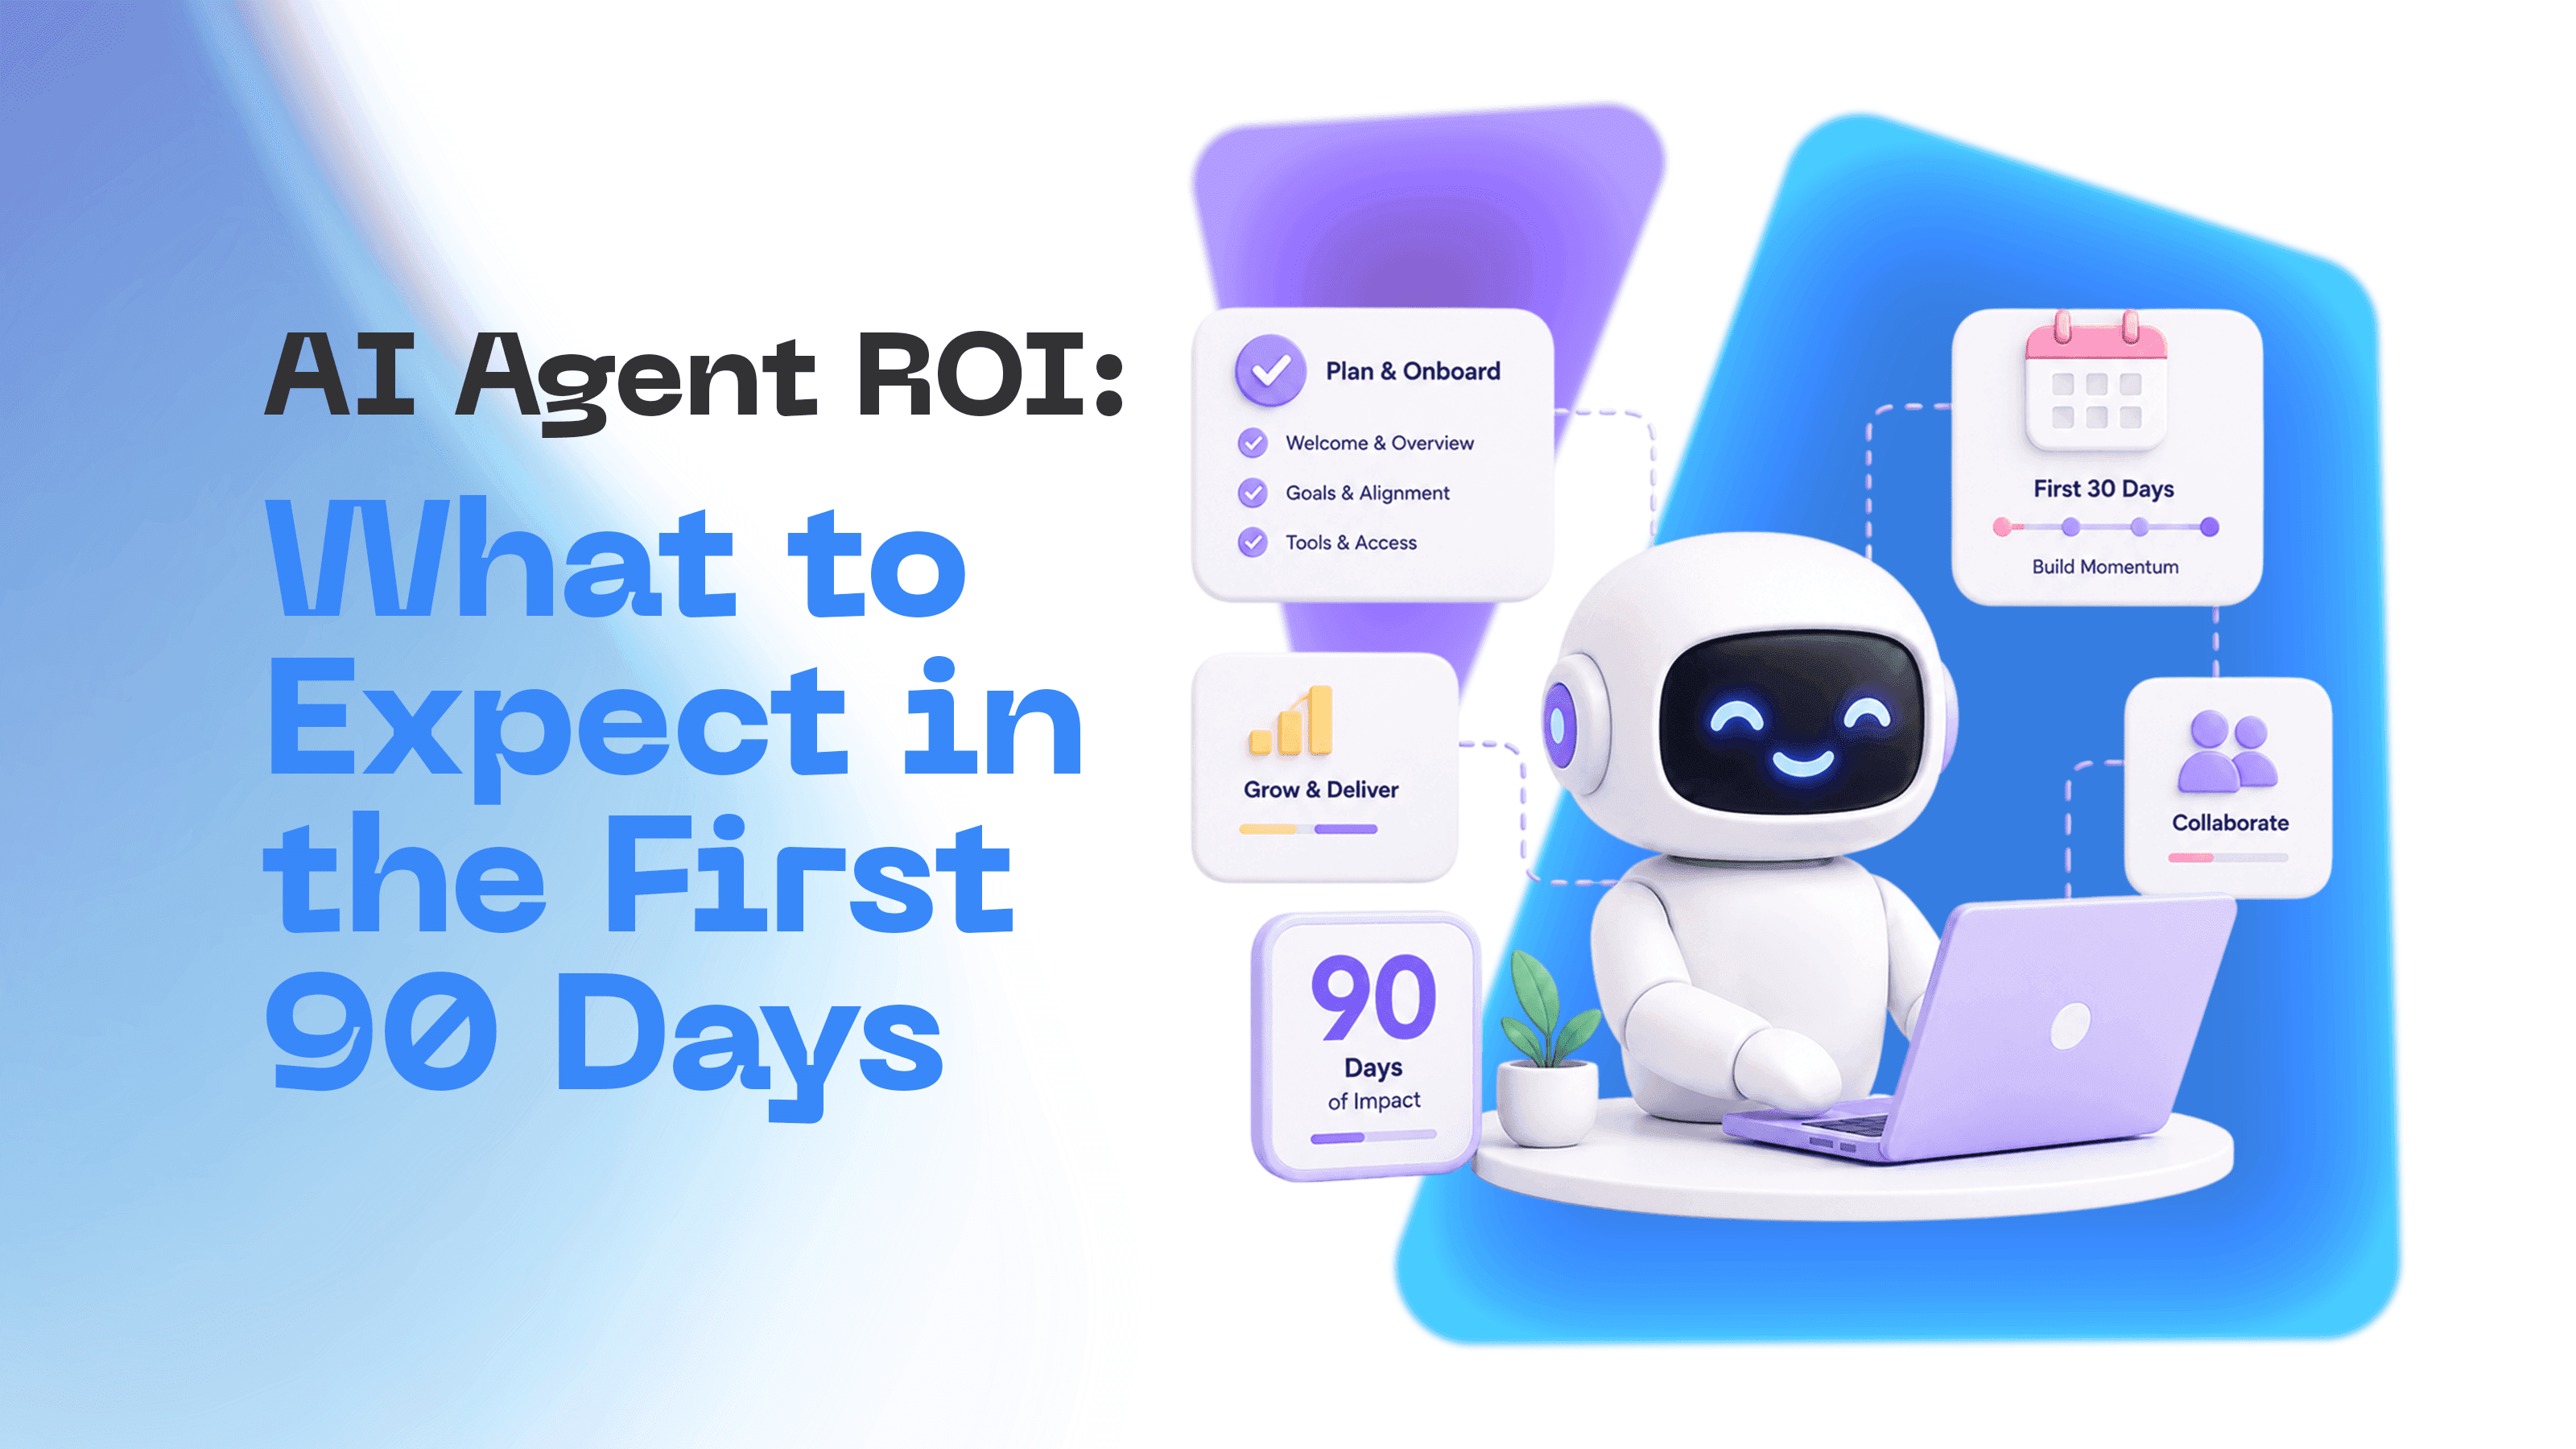
Median time to value across enterprise agent deployments sits at roughly 5.1 months, according to 2026 research from BCG and Forrester, though that figure hides significant variation by function. SDR and sales agents tend to pay back fastest, in around 3.4 months, while finance and operations agents can take closer to 8.9 months because their workflows involve more approval steps and system integrations. Setting a 90-day expectation for full payback is unrealistic for most workflows. A more useful frame is to expect early signals within 30 days, measurable efficiency gains by day 60, and a clear enough picture by day 90 to make a scaling decision.
The Typical Adoption Curve for AI Agents
Vendor-deployed agents reach positive ROI roughly 2.4 times faster than custom-built ones, per Bain's 2026 Agentic AI Benchmark, largely because pre-built integrations and evaluation tooling remove months of setup work. Time to first value averages around 38 days for vendor agents compared with 94 days for in-house builds. This is the core reason the adoption curve looks different depending on how the agent was sourced, and it is worth factoring into any 90-day roadmap before deployment even begins.
Common Reasons ROI Timelines Get Delayed
Only about 41 percent of agent rollouts cross positive ROI within their first year, and close to 19 percent never reach payback at all, based on Gartner's 2026 Agentic AI Pulse survey. The research attributes most of these misses to unclear success criteria, insufficient data or tool access, and evaluation coverage that drifts as real usage diverges from pilot conditions, rather than to any shortfall in the underlying model. Teams that define success metrics and data access requirements before launch consistently avoid these delays.
The First 30 Days: Setup, Integration, and Early Signals
The first month is almost entirely about groundwork. No credible 90-day ROI story skips this phase, because the quality of onboarding directly determines how fast the following two phases move. This is also the period where the temptation to judge ROI too early is strongest and where a documented baseline matters most.
What Happens During Onboarding and Configuration
Configuration in the first 30 days typically covers connecting the agent to existing tools and data sources, defining escalation paths, and setting initial guardrails. Enterprise ROI frameworks published by IBM and other advisory firms in 2026 stress that this stage should also capture a pre-deployment baseline: current cycle time, error rate, and fully loaded labor cost for the task being automated. Without that baseline, it becomes impossible to credibly prove improvement later.
Early Indicators That Deployment Is on Track
In a healthy rollout, the earliest signal is not cost savings but accuracy on real, messy inputs rather than curated pilot data. Research on the pilot to production gap shows that programs achieving strong accuracy in testing routinely lose 12 to 19 percentage points once exposed to the full range of real user requests. Watching for that drop early, rather than being surprised by it in month two, is one of the clearest indicators of whether a deployment is on track.
Metrics to Start Tracking from Day One
- Task volume actually routed to the agent versus the total addressable volume
- Resolution or completion rate on first attempt, without escalation
- Time per task compared with the pre-deployment baseline
- Error or misroute rate compared with the human process it replaces
These four data points, tracked weekly from day one, form the backbone of every ROI calculation that follows in days 31 through 90.
Days 31 to 60: Optimization and Early Wins
The second month is where the gap between a pilot and a production system starts to close. Teams shift from configuring the agent to actively tuning it against real usage patterns, and this is usually when the first credible efficiency numbers appear. It is also the point where scope decisions, expanding or narrowing what the agent handles, have the most influence on the eventual 90 day outcome.
Refining Workflows Based on Real Usage Data
By this stage, teams typically have enough real interactions to identify where the agent struggles and where it consistently performs well. The most effective teams narrow the agent's scope to its strongest use cases first, rather than trying to fix every edge case simultaneously, since attempting full coverage too early is a common reason programs stall before reaching day 90.
Where Teams Typically See First Measurable Time Savings
Cost per task is where the numbers start to become concrete. Forrester's Total Economic Impact studies and enterprise telemetry cited in 2026 research put the cost of a contained customer service interaction handled by an agent at around $0.46, compared with $4.18 for a human-handled one, a roughly ninefold difference. Routine code review tasks show an even wider gap, with agents completing a review for around $0.72 against roughly $48 in senior engineer time. These figures depend heavily on volume and current process cost, but they illustrate why customer service and engineering workflows tend to show the earliest measurable wins.
Adjusting Scope as Agents Prove Reliability
As reliability data accumulates, most teams either expand the agent into adjacent tasks or pull back scope to protect the metrics that are working. SDR and prospecting agents, which show payback in around 3.4 months according to Bain's benchmark, are frequently the first to be expanded because their ROI signal is both fast and easy to isolate from other variables.
Days 61 to 90: Measuring Full ROI Impact
By the third month, enough data should exist to move from early signals to an actual ROI figure. This is also the stage where the business case either strengthens enough to justify further investment or reveals gaps that need to be addressed before scaling. The calculations below are what typically get presented to finance and leadership at the 90 day mark.
Calculating Cost Savings Versus Deployment Investment
Successfully deployed agents report an average ROI of around 171 percent globally, rising to roughly 192 percent in the United States, where labor costs are higher, according to 2026 industry benchmarks. The median payback period across these successful deployments is about 8.3 months, though functions with high task volume and clear success criteria, like customer support, tend to land closer to the 4 to 6 month range. The gap between the 90-day mark and full payback is normal and should be communicated as a trajectory rather than a single point-in-time result.
Productivity Gains Across Departments
Productivity gains extend beyond raw cost savings. Knowledge workers in organizations with mature agent deployments and proper telemetry report saving a median of around 6.4 hours per week, with senior practitioners saving 10 to 12 hours and customer-facing roles closer to 8 to 9 hours, based on 2026 workforce research. Organizations running agentic prospecting report an average 23 percent increase in sales revenue, and agent-assisted support functions report roughly 18 percent improvement in customer lifetime value. These figures vary widely by function and should be validated against each organization's own baseline rather than assumed.
Building a Business Case for Scaling Further
The 90-day mark is the natural checkpoint for deciding whether to scale, pause, or re-scope a deployment. A strong business case at this stage combines the hard numbers, cost per task, time saved, and error reduction, with a clear account of which workflows are ready for expansion and which still need tuning. Programs that name a single accountable owner for the agent's performance before requesting further budget consistently have an easier time securing it.
How to Calculate AI Agent ROI Accurately
Getting the ROI number right matters as much as getting the deployment right, since an inflated or poorly documented figure erodes trust with finance just as quickly as a missed deadline. The formulas below are straightforward, but the discipline is in defining the inputs consistently before the agent goes live, not after.
Key Metrics: Time Saved, Cost Reduced, Revenue Influenced
The standard formula is: ROI percentage = (Value Generated - Total Investment) / Total Investment × 100
Value generated combines time savings converted into fully loaded hourly cost, direct cost reductions from automation, any revenue attributable to the agent, and quantified quality improvements. Total investment should include licensing, implementation, integration, training, and ongoing support, not just the software subscription. The payback period, a simpler and often more persuasive metric for finance, is calculated as:
Payback Period = Total Cost / Monthly Net Benefit Common Calculation Mistakes to Avoid Measuring only hard, easily quantified savings while ignoring the total cost of ownership, including change management and ongoing monitoring for model drift, which industry frameworks estimate can add 15 to 30 percent to annual operating costs.
Skipping the pre-deployment baseline entirely, which makes any later ROI claim impossible to verify. Treating first-year numbers as representative when a J-curve pattern, front-loaded costs, and back-loaded benefits mean early figures typically understate the eventual return.
Tools and Frameworks for Ongoing ROI Tracking Rather than a single audit at the 90-day mark, the most reliable programs track a small, consistent scorecard weekly: one speed metric, one quality metric, one cost metric, and one adoption metric per workflow. IBM's 2026 guidance on maximizing AI ROI separates:
Hard ROI: Direct cost and profit impact Soft ROI: Harder-to-quantify benefits like employee satisfaction or customer experience This allows finance to weigh the two appropriately instead of blending them into one overstated figure.
How Caywork Helps Teams Achieve Faster, Measurable ROI Caywork is built around the same principle this guide has walked through: ROI needs to be measured, not assumed. Caywork's platform gives teams a faster path through the first 90 days by combining pre-built agents with the reporting infrastructure needed to prove impact at each stage, from initial deployment through full scaling decisions.
Pre-Built Agents That Reduce Time to Value Because vendor-deployed agents consistently reach positive ROI faster than custom builds, Caywork's library of pre-built agents is designed to shortcut the first 30 days of setup and integration. Teams connect existing tools and data sources rather than building agent logic from scratch, which shortens the path to the early signals covered earlier in this guide.
Transparent Reporting for Tracking ROI Caywork surfaces the four core metrics, task volume, resolution rate, time per task, and error rate, in a live dashboard from day one, so teams have the baseline and ongoing tracking data this guide recommends without building a separate measurement system.
Calculating Your Own ROI with Caywork's Tools For teams building a 90-day business case, Caywork provides ROI calculation tools that apply the same formula outlined above, using each team's own cost and volume inputs rather than industry averages, so the resulting figure is one finance can actually verify.
Ready to see what your own 90-day ROI could look like? Calculate your ROI with Caywork | Book a Demo
Frequently Asked Questions About AI Agent ROI The questions below cover the details teams most often ask once they have a 90-day plan in place. They are grouped here for quick reference alongside the more detailed explanations earlier in this guide.
How Quickly Can Companies See ROI from AI Agents? Early signals typically appear within the first 30 days, measurable efficiency gains show up around day 60, and a clear ROI figure is usually available by day 90, though full payback often takes several months longer. Median payback across successful deployments is around 8.3 months, with faster functions like customer support and sales landing closer to 4 to 6 months.
What Factors Influence AI Agent ROI Timelines? The clearest factors are:
Whether the agent is vendor-deployed or custom-built How well-defined the success criteria and data access are before launch How much workflow redesign is needed around the agent rather than just the agent's own accuracy Do All Departments See ROI at the Same Pace? No. Customer service and sales tend to show ROI fastest because their tasks are high-volume and easy to measure, while finance and operations workflows typically take longer due to approval steps and system complexity.
What's a Realistic ROI Benchmark for the First 90 Days? A realistic 90-day benchmark is a documented baseline, early efficiency data, and a directional cost-per-task figure, rather than full payback. Full ROI, averaging around 171 percent globally among successful deployments, typically takes several months beyond the 90-day mark to fully materialize.
How Does Caywork Help Measure and Improve ROI? Caywork combines pre-built agents that shorten time to value with built-in reporting on the core metrics this guide recommends tracking and provides ROI calculation tools so teams can turn their own usage data into a business case rather than relying on industry averages.
Caywork helps enterprise teams move through exactly this kind of 90-day journey, from initial agent deployment to a documented, defensible ROI figure. Its pre-built agent library, transparent reporting dashboard, and built-in ROI calculation tools are designed to shorten the setup phase and make the measurement phase far less manual, so teams spend less time building spreadsheets and more time acting on what the numbers show.
References
- Paul Okhrem: 50+ Enterprise AI Agent Statistics (2026): https://paul-okhrem.com/enterprise-ai-agents-statistics-2026/
- Digital Applied: AI Agent Productivity Statistics 2026 - 100+ ROI Data: https://www.digitalapplied.com/blog/ai-agent-productivity-statistics-2026-roi-data-points
- Digital Applied: AI Agent Adoption 2026 - 120+ Enterprise Data Points: https://www.digitalapplied.com/blog/ai-agent-adoption-2026-enterprise-data-points
- WRITER: Enterprise AI Adoption in 2026: https://writer.com/blog/enterprise-ai-adoption-2026/
- ibl.ai: From Chatbots to Agents - Why 80% of Enterprise AI Deployments Now Show Measurable ROI: https://ibl.ai/blog/enterprise-ai-agents-roi-2026
- Ringly.io: 45 AI Agent Statistics You Need to Know in 2026: https://www.ringly.io/blog/ai-agent-statistics-2026
- Azumo: 60+ AI Agent Statistics for 2026: https://azumo.com/artificial-intelligence/ai-insights/ai-agent-statistics
- Digital Applied: Agentic AI Statistics 2026 - 150+ Data Points Collection: https://www.digitalapplied.com/blog/agentic-ai-statistics-2026-definitive-collection-150-data-points
- GoGloby: AI Agent Adoption Statistics 2026: https://gogloby.com/insights/ai-adoption-statistics/
- AIStratagems: Agentic AI Statistics 2026: https://aistratagems.com/agentic-ai-statistics-2026/
- Larridin: The AI ROI Measurement Framework: https://larridin.com/blog/ai-roi-measurement
- IBM: How to Maximize AI ROI in 2026: https://www.ibm.com/think/insights/ai-roi
- Shopify: How to Calculate ROI for AI Investments (2026): https://www.shopify.com/enterprise/blog/ai-roi